Along with my colleagues Steve Holloway, Taylor Hafley, and Mathew Hauer, I have constructed a database called the Historical Housing Unit and Urbanization Database v2010, or HHUUD10. This dataset provides housing unit counts and urbanization year estimates in consistent census tract boundaries for every tract in the Continental US from 1940 to 2019. HHUUD10 can be used to analyze the historical geographies of housing loss and gain, urban renewal, (sub)urbanization, and more. The data, the R and Python code used to construct it, and a full write-up of the methods are all free and open access at Scientific Data! Altnernatively, the data and code can be downloaded directly from Open Science Framework or from Esri’s Living Atlas.
HHUUD10 data can be used to track historical housing unit changes at the tract level. The map below shows estimated housing unit changes from 1940 to 2019.
See Map on ArcGIS Online
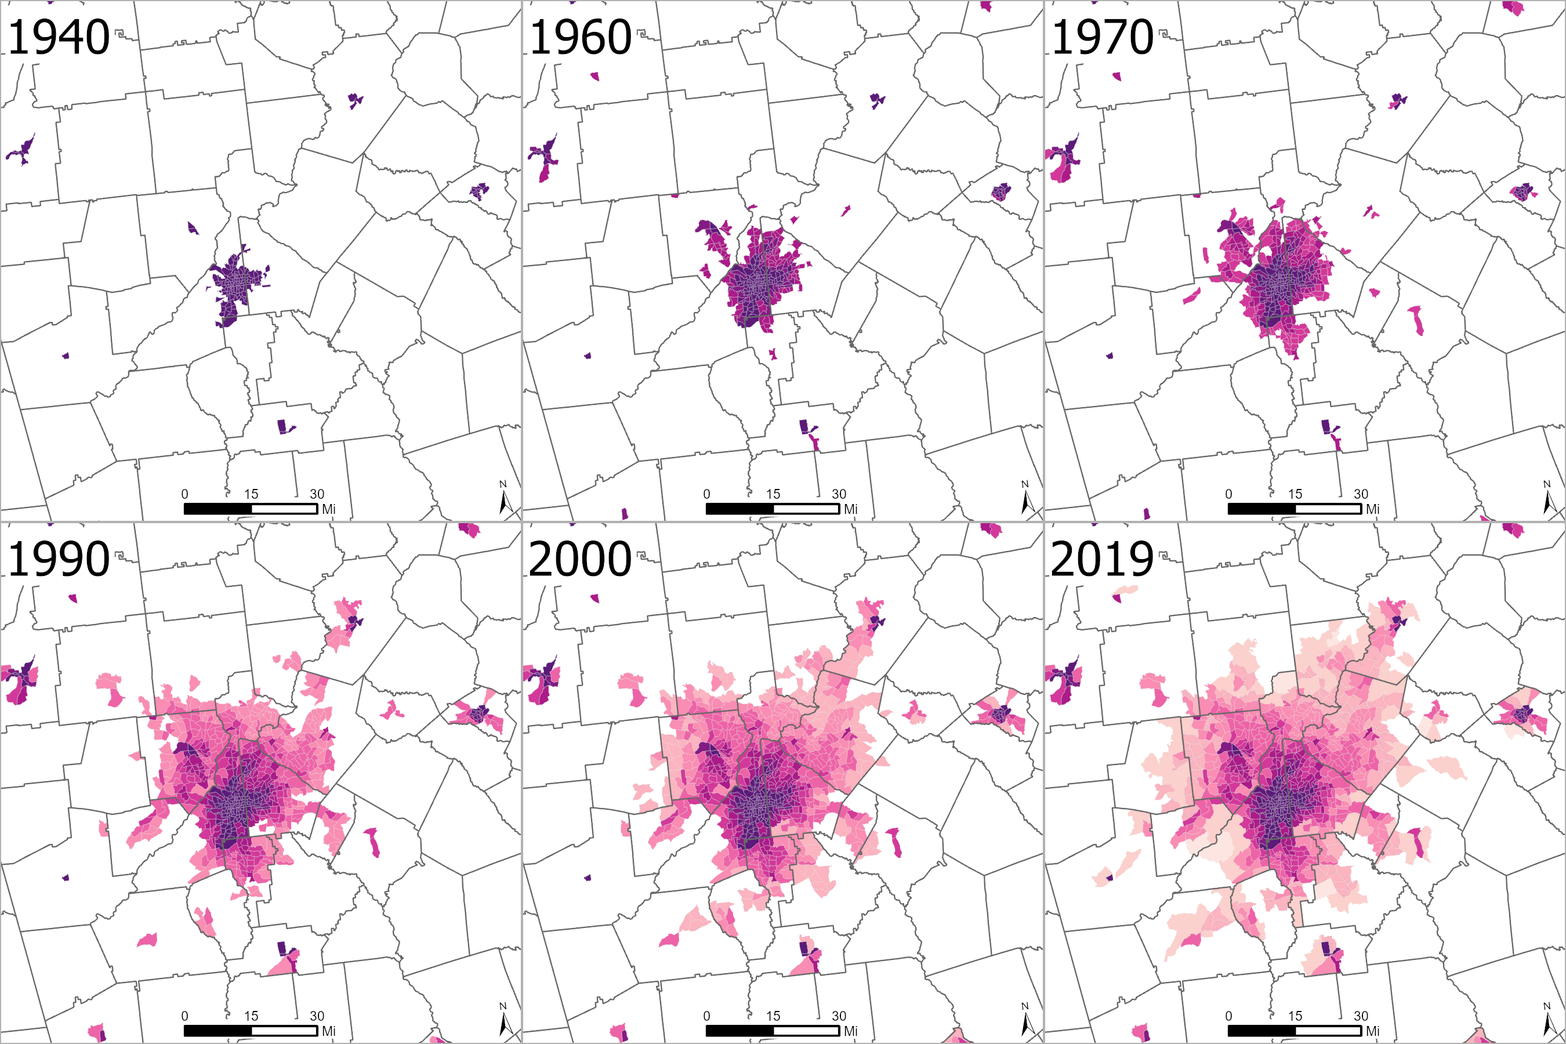
HHUUD10 data can also be used to capture sub/urbanization through time. The graphic below shows this process in the Atlanta region. Once a tract surpasses 200 housing units per dasymetrically refined square mile—i.e., the tract surface area minus water, parks, golf courses, airports, cemeteries, and railyards—or is significantly covered by non-residential urban land uses, we consider it “urban.”
Urbanization in Metro Atlanta by 2010 Census Tracts, 1940-2019
